
22 Email Marketing Metrics to Measure Success
Every email marketer knows the feeling when an email goes out: one part relief, one part anxiety. When you hit “send,” the hard part is over, and you can sit back and wait for the results to roll in to judge whether the email you sent was successful. Knowing these insights is powerful—they fuel future growth for your email marketing program.
But what email metrics and key performance indicators (KPIs) should you measure? What does your email service provider (ESP) or marketing automation platform (MAP) and third-party analytics tools offer you?
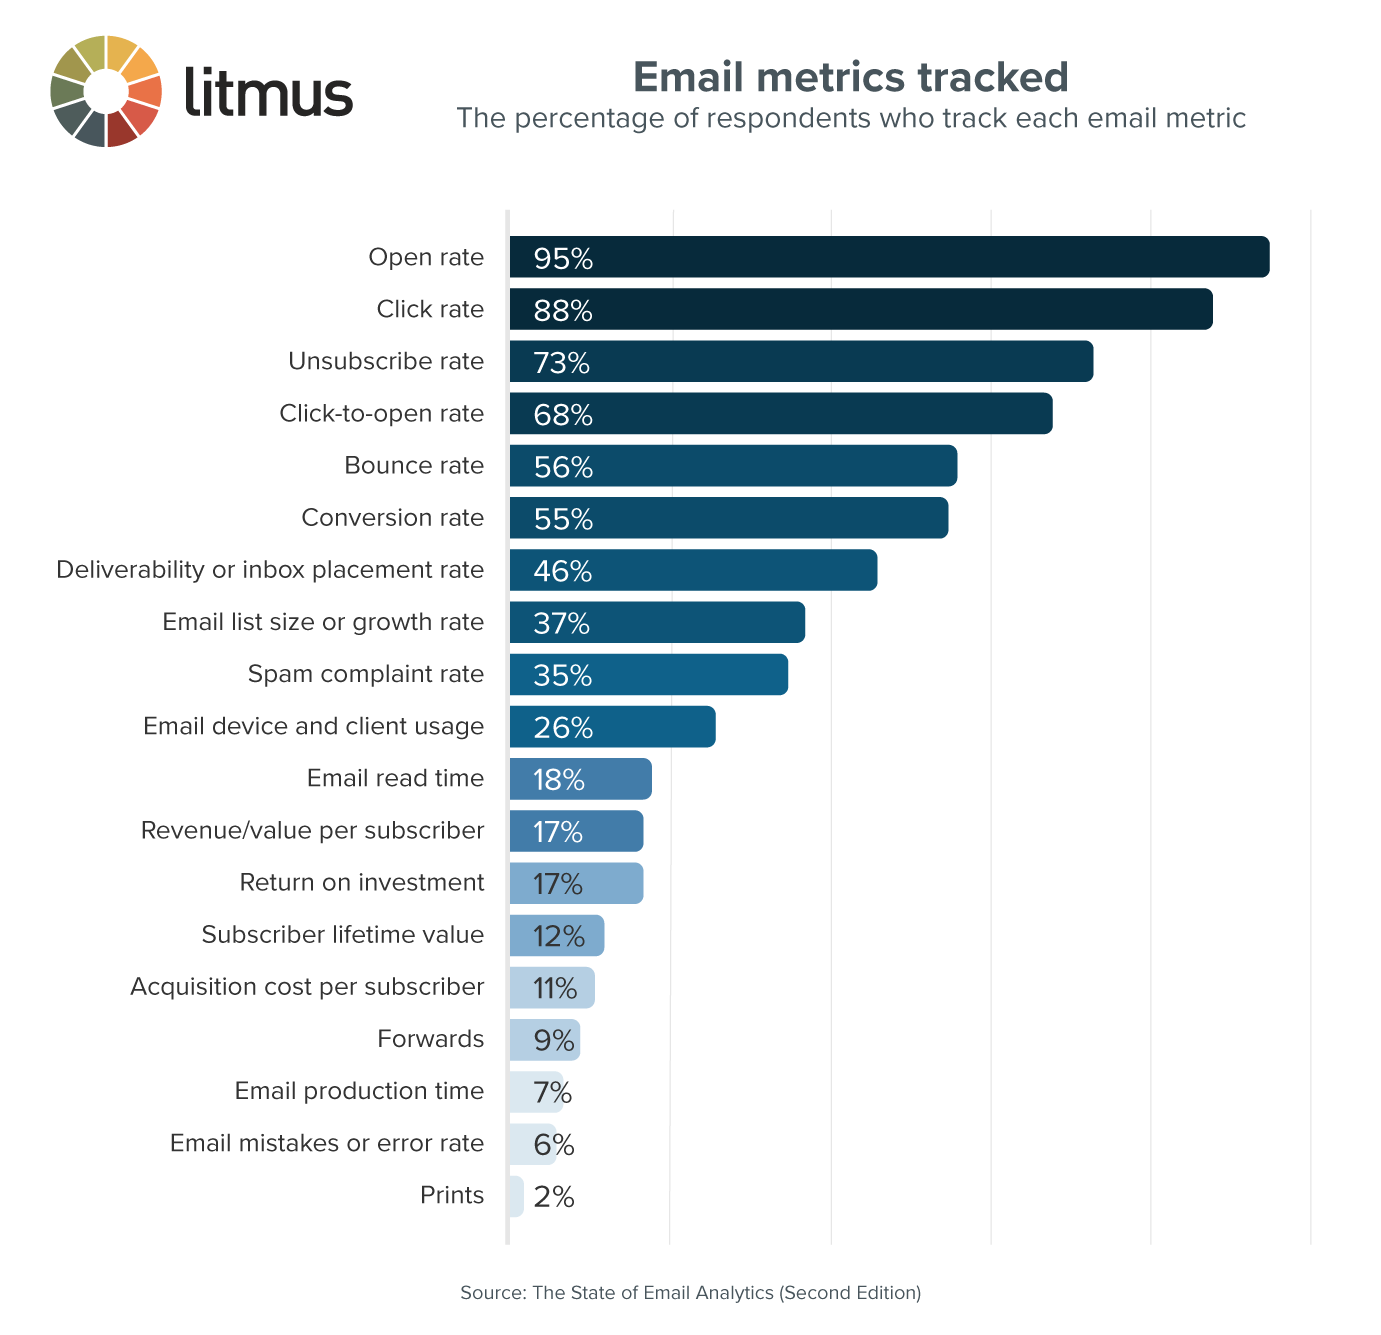
We asked thousands of marketers what metrics they currently track. Here’s what we found.
What are email marketing metrics?
Email marketing metrics are data points that let you know how your campaigns perform. Metrics can tell you if your emails stand out in the inbox, if they encourage subscribers to engage, and whether they move the needle on goals like increasing revenue.
Keep in mind: it’s best to take a holistic view of email metrics and benchmark against your own program. You don’t know what’s “good” or “bad” for a brand or the tactics used to achieve their numbers. All that matters is that your program continually strives to be better.
Why you should track email marketing metrics
Email marketing metrics the actual success of your emails, instead of just relying on vibes. You can use email marketing metrics to:
- Test your assumptions
- Write better email subject lines and copy
- Send more relevant and helpful content
- Monitor and maintain delivery and deliverability
- Prove the value of your email marketing program
- Improve your email marketing strategy and designs continuously
- Share your progress and insights with your team and leaders
- Get executive buy-in for more email marketing budget
Basic Email Marketing Metrics
Let’s start with the most common and easy-to-track email marketing metrics every team should monitor. Luckily, many of these analytics are available in even simple, free email marketing tools.
Open rate
The open rate is how many of your delivered emails were ‘opened.’ It’s great for gauging the effectiveness of subject lines, monitoring email deliverability, and measuring high-level subscriber engagement—as long as your email ltool’s open pixel loads and the open registers.
Open rates can be inaccurate if someone has their inbox preview pane on by default or opens your email just to delete it. In other words, people may not have actually opened or read your email. It also means if people have images blocked, you can’t see whether or not they opened your email (even if they did). There’s a reason many call the open rate a vanity metric.
And with Apple’s Mail Privacy Protection, the open rate for your Apple Mail users may be overinflated (and useless). So be careful not to rely too heavily on open rates for overall program success, especially if your audience is largely made up of Apple Mail users.
Calculating open rate
Open rate = (number of emails opened / number of emails delivered) x 100
P.S. Not sure what delivered means? Skip to the bounce rate section below.
Bounce rate
The email bounce rate is how many of your sent emails bounced—or weren’t delivered—regardless of whether it was a hard bounce or a soft bounce.
On the flip side, you may measure the delivered rate instead, which is 100% minus the bounce rate. So, if your bounce rate is 5%, your delivered rate is 95%. Any calculation that calls for the number of emails delivered should use the number of sent emails minus the number of bounced emails.
You want to aim for a bounce rate of 2% or less (or a delivered rate of 98% or more).
If your bounce rate is too high, it’s a sign the email addresses on your list are bad, usually due to poor email list hygiene or problematic acquisition sources (you aren’t buying or renting lists, right?). If you don’t do something about it right away, this can ultimately hurt your ability to land in the inbox.
Calculating bounce rate
Bounce rate = (number of emails bounced / number of emails sent) x 100
Click-through rate (CTR)
The click-through rate (CTR) is how many of your delivered emails were clicked on. Some may refer to CTR as clicks over opened instead, but for clarity, we’re using delivered here and will talk about the measure of clicks against opens in the next section.
The CTR leaves opens out of the equation, giving you an unbiased look at email performance.
Calculating CTR
Click-through rate = (number of emails clicked / number of emails delivered) x 100
Click-to-open rate (CTOR)
The click-to-open rate (CTOR) is how many of your opened emails were clicked on. This is different from CTR as it relies on opens and is a great way to measure the effectiveness of your subject line. Did your email meet the expectations set in your subject line and preview text (high CTOR)? Or was it merely misleading (low CTOR)?
Want to up your subject line game? Check out these 18 subject line tips from experts.
Calculating CTOR
Click-to-open rate = (number of emails clicked / number of emails opened) x 100
Unsubscribe rate
The unsubscribe rate measures how many people opt out of your emails, and in general, you want to aim for less than 1-2% to stay on the good side of deliverability.
Depending on your email platform, an unsubscribe may be recorded if a person actually opts out or if they just click your unsubscribe link.
Keeping track of your unsubscribe rate is a nice way to check on how healthy your email list and permission practices are and if certain content doesn’t resonate well with a specific audience. Unsubscribes are not necessarily bad—letting go is infinitely better than being marked as spam—so be sure to make unsubscribing painless.
Calculating unsubscribe rate
Unsubscribe rate = (number of unsubscribes / number of emails delivered) x 100
Spam complaint rate
What else can throw your emails into the junk folder? The spam complaint rate. It measures how many people report or mark your email as spam.
Anything above 0.1% is concerning. You normally get spam complaints if people don’t know or remember you, are really annoyed by your content, or don’t know how to unsubscribe. That’s why it’s important to make finding the unsubscribe link and the actual unsubscribe process ridiculously easy.
You may also want to take a closer look at your acquisition practices, send frequency, and content or segmentation strategies.
Calculating spam complaint rate
Spam complaint rate = (number of spam complaints / number of emails delivered) x 100
Email list size or growth rate
Without an email list, you have no one to send your emails to. And if your list isn’t growing? Then your email program can’t grow either. Email list growth is how much your list is growing instead of churning. So, you always want this to be positive.
Calculating email list growth rate
List growth rate = ((monthly new subscribers – monthly churned subscribers) / list size) x 100
Feel free to swap the monthly time period with one that makes sense for your brand.
Calculating email list churn rate
Alternatively, you could look at churn rate which measures how many people are removed or suppressed from your email list. This would include unsubscribes, bounces, manual removals, or even unengaged subscribers. It’s good to have this number so you know how much you need to grow your list to have a positive growth rate.
Here’s how to get that:
Churn rate = (monthly churned subscribers / list size at beginning of month) x 100
Email production time
How efficient is your email marketing process? Where can you make improvements? Knowing your email production time can help with that.
Calculating email production time
There are two types of time you’ll want to keep track of:
- Actual time to complete each task (e.g. 90 minutes to code one email)
- Time period from email conception to execution (e.g. 14 days to create and send one email)
While one email may take 10 working hours, people often juggle multiple tasks, which is why you should track at both the granular and high level. For example, maybe it only takes 15 minutes to review an email, but the reviewer isn’t able to get to it until two days later.
How does your workflow stack up?
Find out how marketers like you manage their email marketing time, and identify opportunities for improving your own—in our State of Email Workflows report.
More advanced email marketing metrics
41% of marketers say that email is their most effective marketing channel, but you probably need the stats to back up your efforts when you’re sharing your progress with peers (and bosses!).
The email marketing metrics we’ll cover next are slightly more advanced either because you need to gather a bit more data for the equations or you might need advanced analytics tools in your email stack.
Email read rate or read time
The read rate is how many of your opened emails were actually read. This is a great metric for editorial emails, important updates like privacy notices, and those without a call-to-action (CTA).
The definition of “read” may differ depending on your email tool, but in most cases, it’s having an email opened for eight or more seconds.
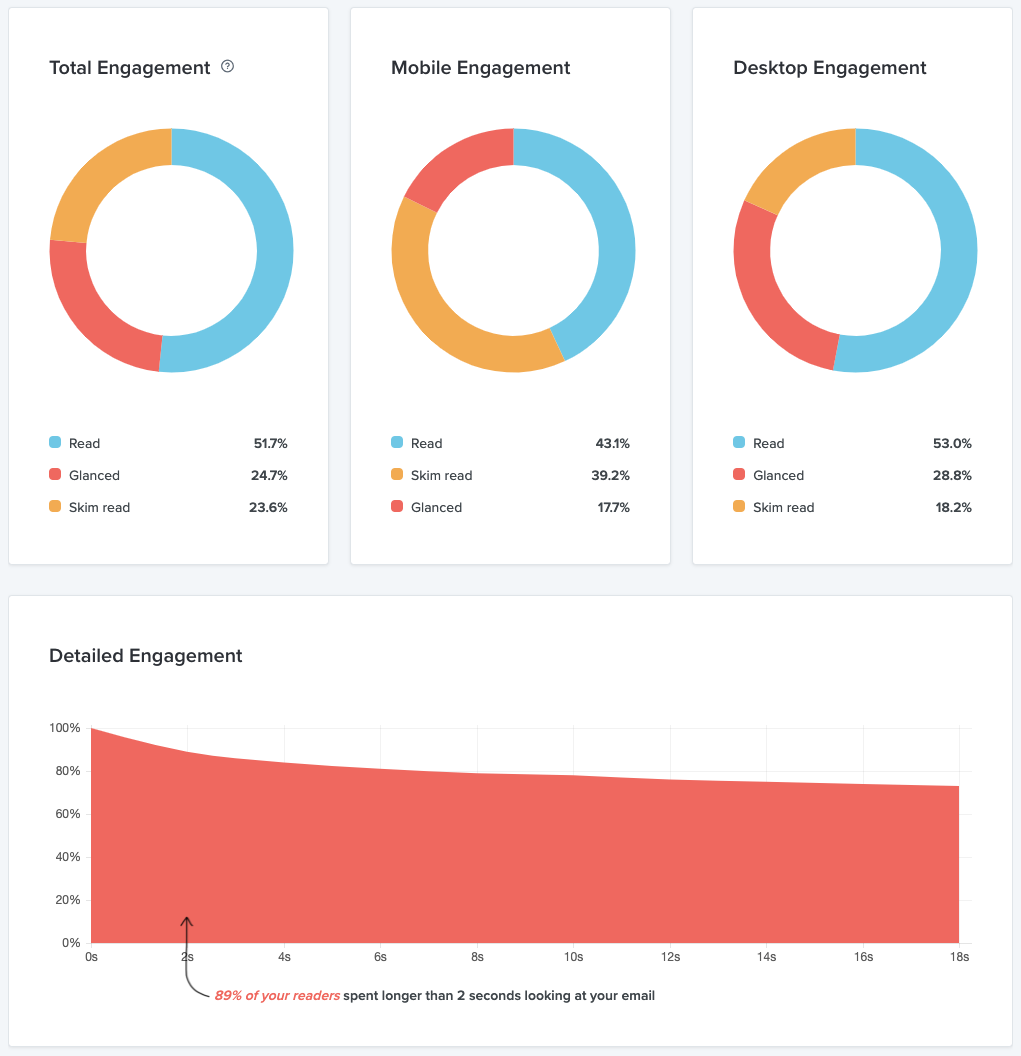
With Litmus Email Analytics, you can drill down even further to see who has skimmed (2-7 seconds) or glanced (less than 2 seconds) as well as get a detailed view of read time—how long your email was opened for.
Calculating read time
Read rate = (number of emails read / number of emails opened) x 100
Deliverability rate or inbox placement rate
All of the above (and so many other factors no one knows) play into your deliverability rate a.k.a. inbox placement rate. The deliverability rate is how many of your emails land in the inbox vs. the junk or spam folder. The difference between deliverability and delivered is that an email counts as delivered even if it’s in junk—in other words, was received by inbox providers—whereas deliverability specifically looks at where your email was delivered.
If your inbox placement rate is low—less than 80%—it may mean you’re not sending the right content to the right audience at the right time. No, we’re not talking about spam trigger words. It’s much more complicated than that. The top things are to make sure you have a great list, authenticate your emails, and send relevant content.
Calculating deliverability rate
Deliverability rate = (number of non-junked emails delivered / number of emails delivered) x 100
Conversion rate (CVR)
The email conversion rate measures how many people took the action you wanted them to from your email. A conversion depends on your email’s goal and could be anything from a purchase or donation to a webinar sign-up or ebook download.
I personally like to look at conversion rate based from email clicks to see a direct attribution, but looking at it from how many emails were delivered gives you a view into indirect attribution. Just because someone didn’t click your email doesn’t mean they didn’t convert because of it.
Calculating conversion rate
Conversion rate = (number of conversions / number of emails delivered) x 100
Revenue per email (RPE)
Revenue per email (RPE) gives a direct monetary value to your email sends. If you calculate this for different email types, you can reliably forecast email revenue as you plan for the months ahead. And if RPE is lower than your average? It could mean your content, product, or service isn’t hitting the right note with your audience.
Calculating revenue per email
Revenue per email = revenue generated / number of emails delivered
Healthy email list. Healthy ROI.
Subscribers fuel your overall email program success. Learn how to get more good subscribers. And more revenue.
Revenue per subscriber (RPS)
Revenue per subscriber (RPS) is a little different from RPE in that you’re looking at the value of an email subscriber, not an email send. This distinction is important to include all of your active subscribers, even the ones you don’t always send to (and you shouldn’t be sending everything to everyone anyway).
Be sure to look at a specific point in time, like last month or last year.
Calculating RPS
Revenue per subscriber = revenue generated / number of active subscribers
Subscriber lifetime value (LTV)
Subscriber lifetime value (LTV) measures the value a subscriber brings throughout their lifetime on your list. Truth be told, this one’s tricker to calculate because you’ll need to have the right data.
Subscriber LTV is an especially useful metric when compared to acquisition cost (more on that below) because you’ll want to make sure LTV is higher to make the acquisition effort worthwhile. You may even want to calculate LTV per acquisition source to determine which sources are or aren’t working.
I also like to use this when considering whether or not an email is worth sending based on the value of subscribers I can expect to lose from unsubscribing vs. the value I get from sending the email.
Calculating LTV
Subscriber lifetime value = monthly revenue per subscriber x average number of months a subscriber stays on your list
Months can be swapped with days, weeks, or years, depending on your subscriber lifecycle. To get the average time a subscriber stays on your list, you’ll have to look at your unsubscribe or suppression list and get the average time between their subscribe and unsubscribe dates.
For example, if your monthly RPS is $30 and subscribers tend to stay on your list for 7 months before unsubscribing, then consider your subscriber LTV to be $210.
Return on investment (ROI)
Email marketing return on investment (ROI) is a measure of how much value your email marketing program delivers versus how much it costs.
Your email marketing cost may be hard to measure unless you manage the email marketing budget. This cost considers both your tools and your team (including agencies, contractors, and freelancers). ROI, and especially potential ROI, is the perfect way to get the budget for more resources or buy-in for a new project.
Calculating email ROI
Return on investment = (email revenue – email marketing cost) / email marketing cost
What leads to better ROI?
The average email marketing ROI is 36:1—but some brands get much more than that. Find out what factors correlate with higher returns in our CMO’s Guide to Email Marketing ROI (not just for CMOs!).
Forward rate/email sharing
Email forwards is how many times people click the forward function in their email client after they open your email. Pretty straight forward, right? 😉 This is something you want to keep track of if your goal is to create share-worthy content.

Calculating forward rate
Forward rate = (number of emails forwarded / number of emails opened) x 100
Prints
Prints measures how many people click the print function within the email client after they open your email. Consider this metric for coupons that need to be printed and brought in store and things like instructions, directions, tickets, or confirmations.

Calculating email print rate
Print rate = (number of emails printed / number of emails opened) x 100
Subscriber acquisition cost
Email subscriber acquisition cost is how much it costs on average to get one new subscriber. This one’s useful for those who do paid ads, giveaways, or co-marketing campaigns.
A lower cost seems ideal at first, but that can sometimes mean lower quality subscribers. Use your subscriber LTV to drive how much you’re willing to spend on high quality email subscribers.
Calculating subscriber acquisition cost
Email subscriber acquisition cost = marketing or ad cost / number of new subscribers
Email device and client usage
Email device and client usage is how many of your subscribers open emails on each email client, app, or device. Here’s an example of what that looks like in Litmus Email Analytics:
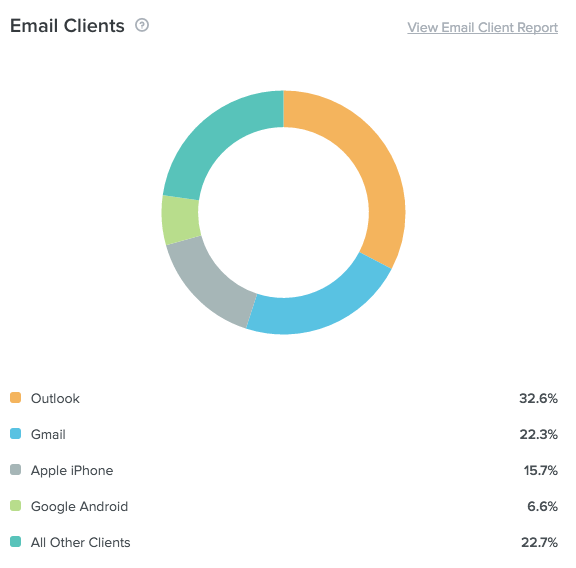
Knowing this data helps you choose where to spend your development and quality assurance (QA) efforts. Want to do fun animated GIFs or embed a video in your email, and have mostly Outlook 2007 users? Not worth it. This metric is also good for troubleshooting deliverability issues if you can isolate the problem to a specific inbox or internet service provider (ISP).
Email mistakes or error rate
Everyone makes mistakes, but making too many is bad for brand reputation, trust, and credibility. A high error rate may mean you need to slow down or improve your QA process.
As with many of the calculations here, choose a time period that best fits your needs. It doesn’t have to be on a monthly basis. The higher your send frequency, the shorter the time period you’ll want to look at. For example, if you sent 54 emails this quarter and 2 of them had a mistake, then your error rate would be 3.7%.
Calculating error rate
Error rate = (monthly number of emails sent with an error / monthly number of emails sent) x 100
Email errors to watch for (and how to fix them)
Dive into the most common issues that will break your emails, find out the impact on your email marketing program, and get practical tips & tricks to create on-brand, error-free emails.
Current state of email analytics
Almost all ESPs offer the basics—opens, clicks, and unsubscribes—and the overwhelming majority of brands do track these metrics. However, after that, visibility diminishes quickly.
According to our State of Email Analytics report, nearly half of brands (45%) don’t track email interactions down to conversions. Fewer than a fifth (17%) measure their email marketing return on investment (ROI). And only 12% of brands measure subscriber lifetime value (LTV).
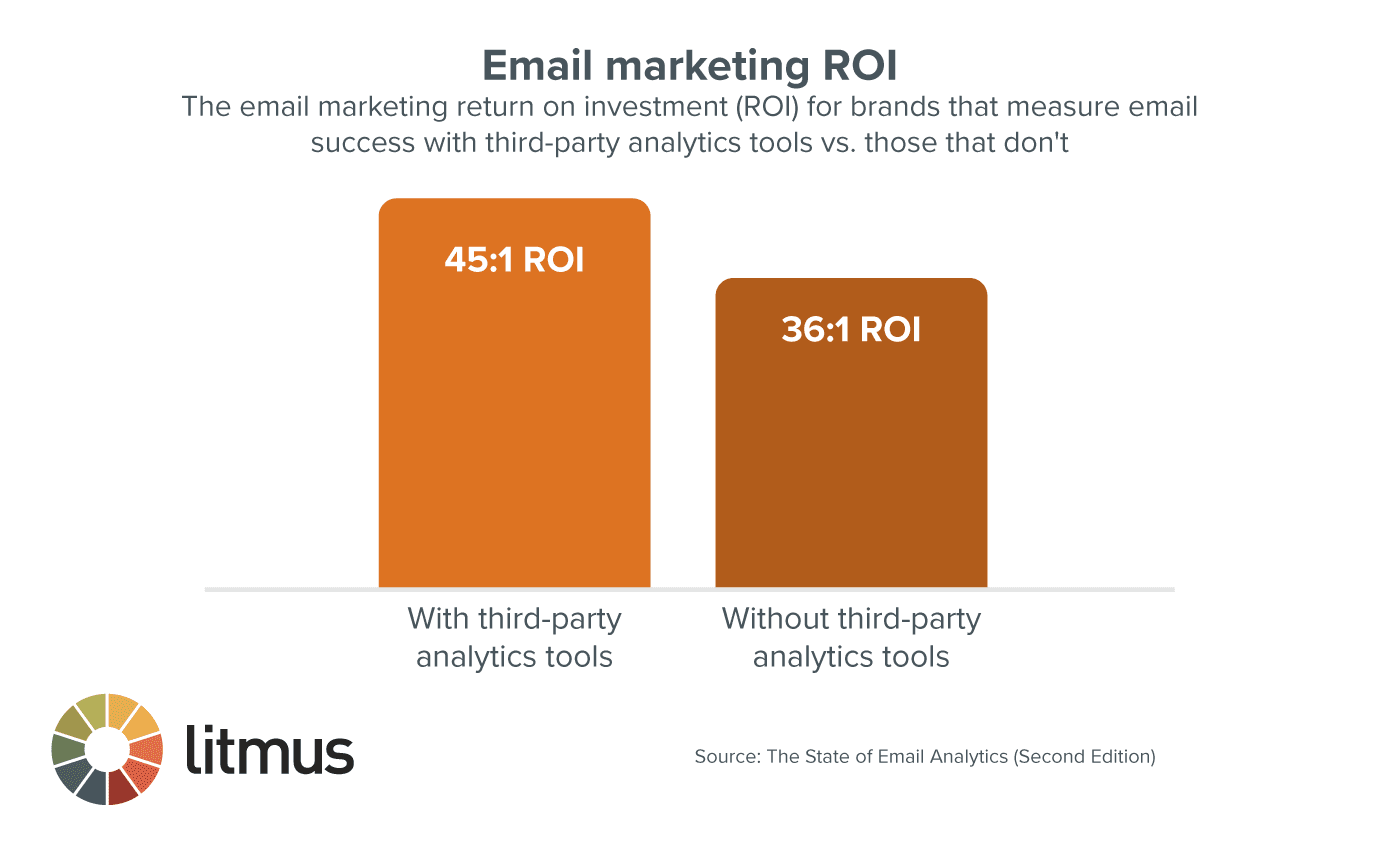
Brands using third-party analytics tools are much more likely to measure monetary value from their email marketing campaigns like revenue per subscriber, LTV, and ROI.
This is great because the better you can track, the better you can optimize. Marketers who use third-party analytics tools see a 25% higher ROI than those who don’t.
On a similar note: When you give everyone—not just your email team—a look into how your email program is performing, you give them the power to use email insights across your company. In turn, this can improve overall marketing effectiveness. Brands that always share email results to both their marketing and non-marketing teams see a 28% higher ROI!
Track the metrics that align with your goals
You can’t keep track of every possible data point—nor should you. And one metric might be important for one campaign but not another. It all boils down to your goals and what KPIs can help you measure success toward those goals. Empowered with the right insights, you can see what works and what needs improvement so you’re always delivering what both your subscribers and stakeholders want.
Here are a few examples of the email metrics you should track depending on your goals:
- Measure email list growth and subscriber acquisition cost when you’re trying to grow your email program
- Measure CTR, CTOR, prints, forwards, and unsubscribe rate when you want to make your emails more engaging
- Measure email production time and error rate when you want to improve your processes
- Measure conversion rate, revenue per email, subscriber lifetime value, and ROI when you want to use email to drive sales
Turn your email marketing metrics into actionable insights
What metrics do you track? Are there any we’re missing from this list?
If you want to learn more from each email you send, Litmus Analytics gives you information like what percentage read vs. skimmed vs. glanced at your message, how many opens Apple Mail Privacy impacted, and where subscribers open and view your emails.

Dig deeper than the data your email platform gives you
Go beyond opens and clicks with Litmus Email Analytics. Better understand your audience and the performance of your email campaigns.
Originally published on April 23, 2019, by Whitney Rudeseal Peet.
Steph Knapp
Steph Knapp is a Freelance Content Writer for SaaS and B2B companies